Kernel-Level Monitoring with eBPF

Overview
Netwatch is a Linux monitoring agent that I built to learn how the eBPF works in real and to get much more accurate metrics. This attaches eBPF probes to kernel functions and tracepoints, exports the results in a Go userspace agent, and exports them as Prometheus metrics and visualize in Grafana.
When a server becomes slow & unresponsive , we start troubleshooting by using familiar tools These tools are very useful for basic troubleshooting but it mostly shows just averages, these can’t tell you how long a process waited for a CPU or how long a each disk request took.
And Also what if it is a sensitive environment that needs real-time accurate metrics? That’s when we need to look inside the kernel. This is where EBPF comes in.
eBPF (Extended Berkeley Packet Filter) allows us to attach light programs to selected kernel events and monitor what’ happens when each time those events fire . The programs run inside the kernel, so they can filter and aggregate data there, and only the results need to be sent to user space instead of every raw event.
This idea leads me to create this EBPF based monitoring system - netwatch
Stack: C (eBPF), Go with cilium/ebpf and bpf2go, the Prometheus client library, Prometheus, Grafana.
What is eBPF?
eBPF is a groundbreaking Linux kernel-level technology introduced in Linux 4.x that allows attaching small programs to run in response to specific kernel events and run them each time when a event fires. This is a way to watch inside from the kernel literally as things happen usually with a low overhead .
Example:
- When TCP retransmits a segment, an ebpf program can record info about that event
- When a process become runnable, an ebpf program can measure how long it waits before gets a CPU allocation
Why eBPF matters in industry
eBPF is no longer a niche tool. It runs in production at large companies:
- Networking: Meta’s Katran load balancer, handled traffic to facebook.com since 2017, and Cloudflare’s DDoS protection are built on eBPF and XDP. Cilium, used in Google’s GKE, uses it for Kubernetes networking and security.
- Ecosystem: the eBPF Foundation, hosted by the Linux Foundation, was founded in 2021 by Meta, Google, Isovalent, Microsoft and Netflix, and Microsoft has ported eBPF to Windows.
Is eBPF considered safe?
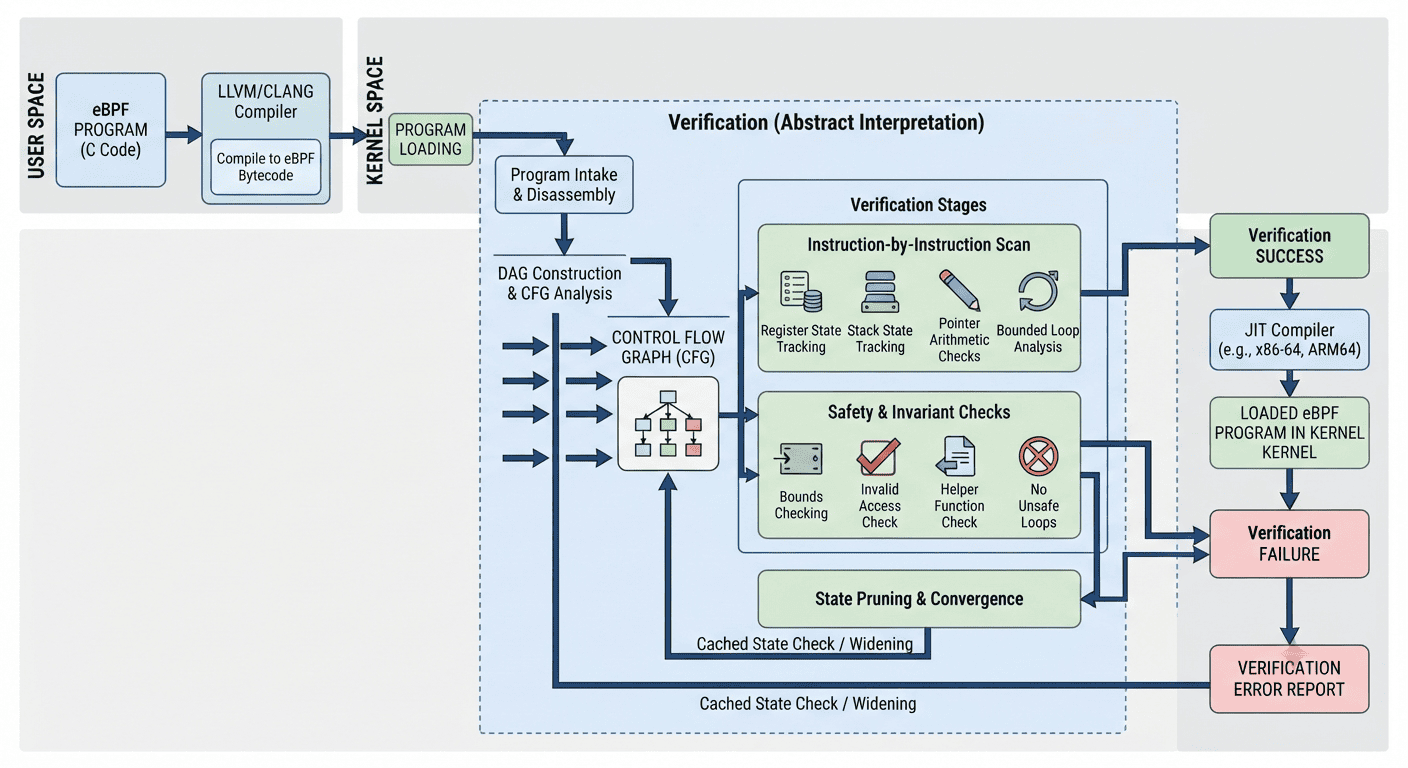
Executing a custom code inside kernel is a risk, a single bug can crash the system, corrupt kernel memory, or hang in a infinite loop.
This is where EBPF Verifier comes .
When a program is loaded, the kernel analyzes for every possible execution path before the program is allowed to run inside system. And It rejects programs that can
- read or write memory outside what they are allowed to access
- dereference a pointer that might be NULL
- run an unbounded loop
- call kernel functions that eBPF programs aren’t allowed to call
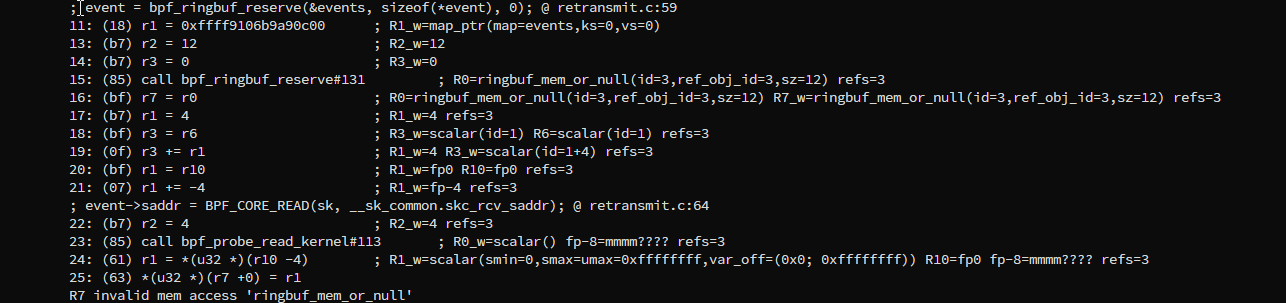
So program that fails any check is rejected at load time and never attaches to anything. Also Programs run in a restricted isolated sandbox environment. they can only use a fixed set of approved helper functions, and loading them requires elevated privileges . The verifier is designed to prevent a bad probe from crashing the kernel, which is why eBPF is considered safe for production use. See what happens when Verifier triggers (explained in below paragraphs)
How do the events reach userspace?
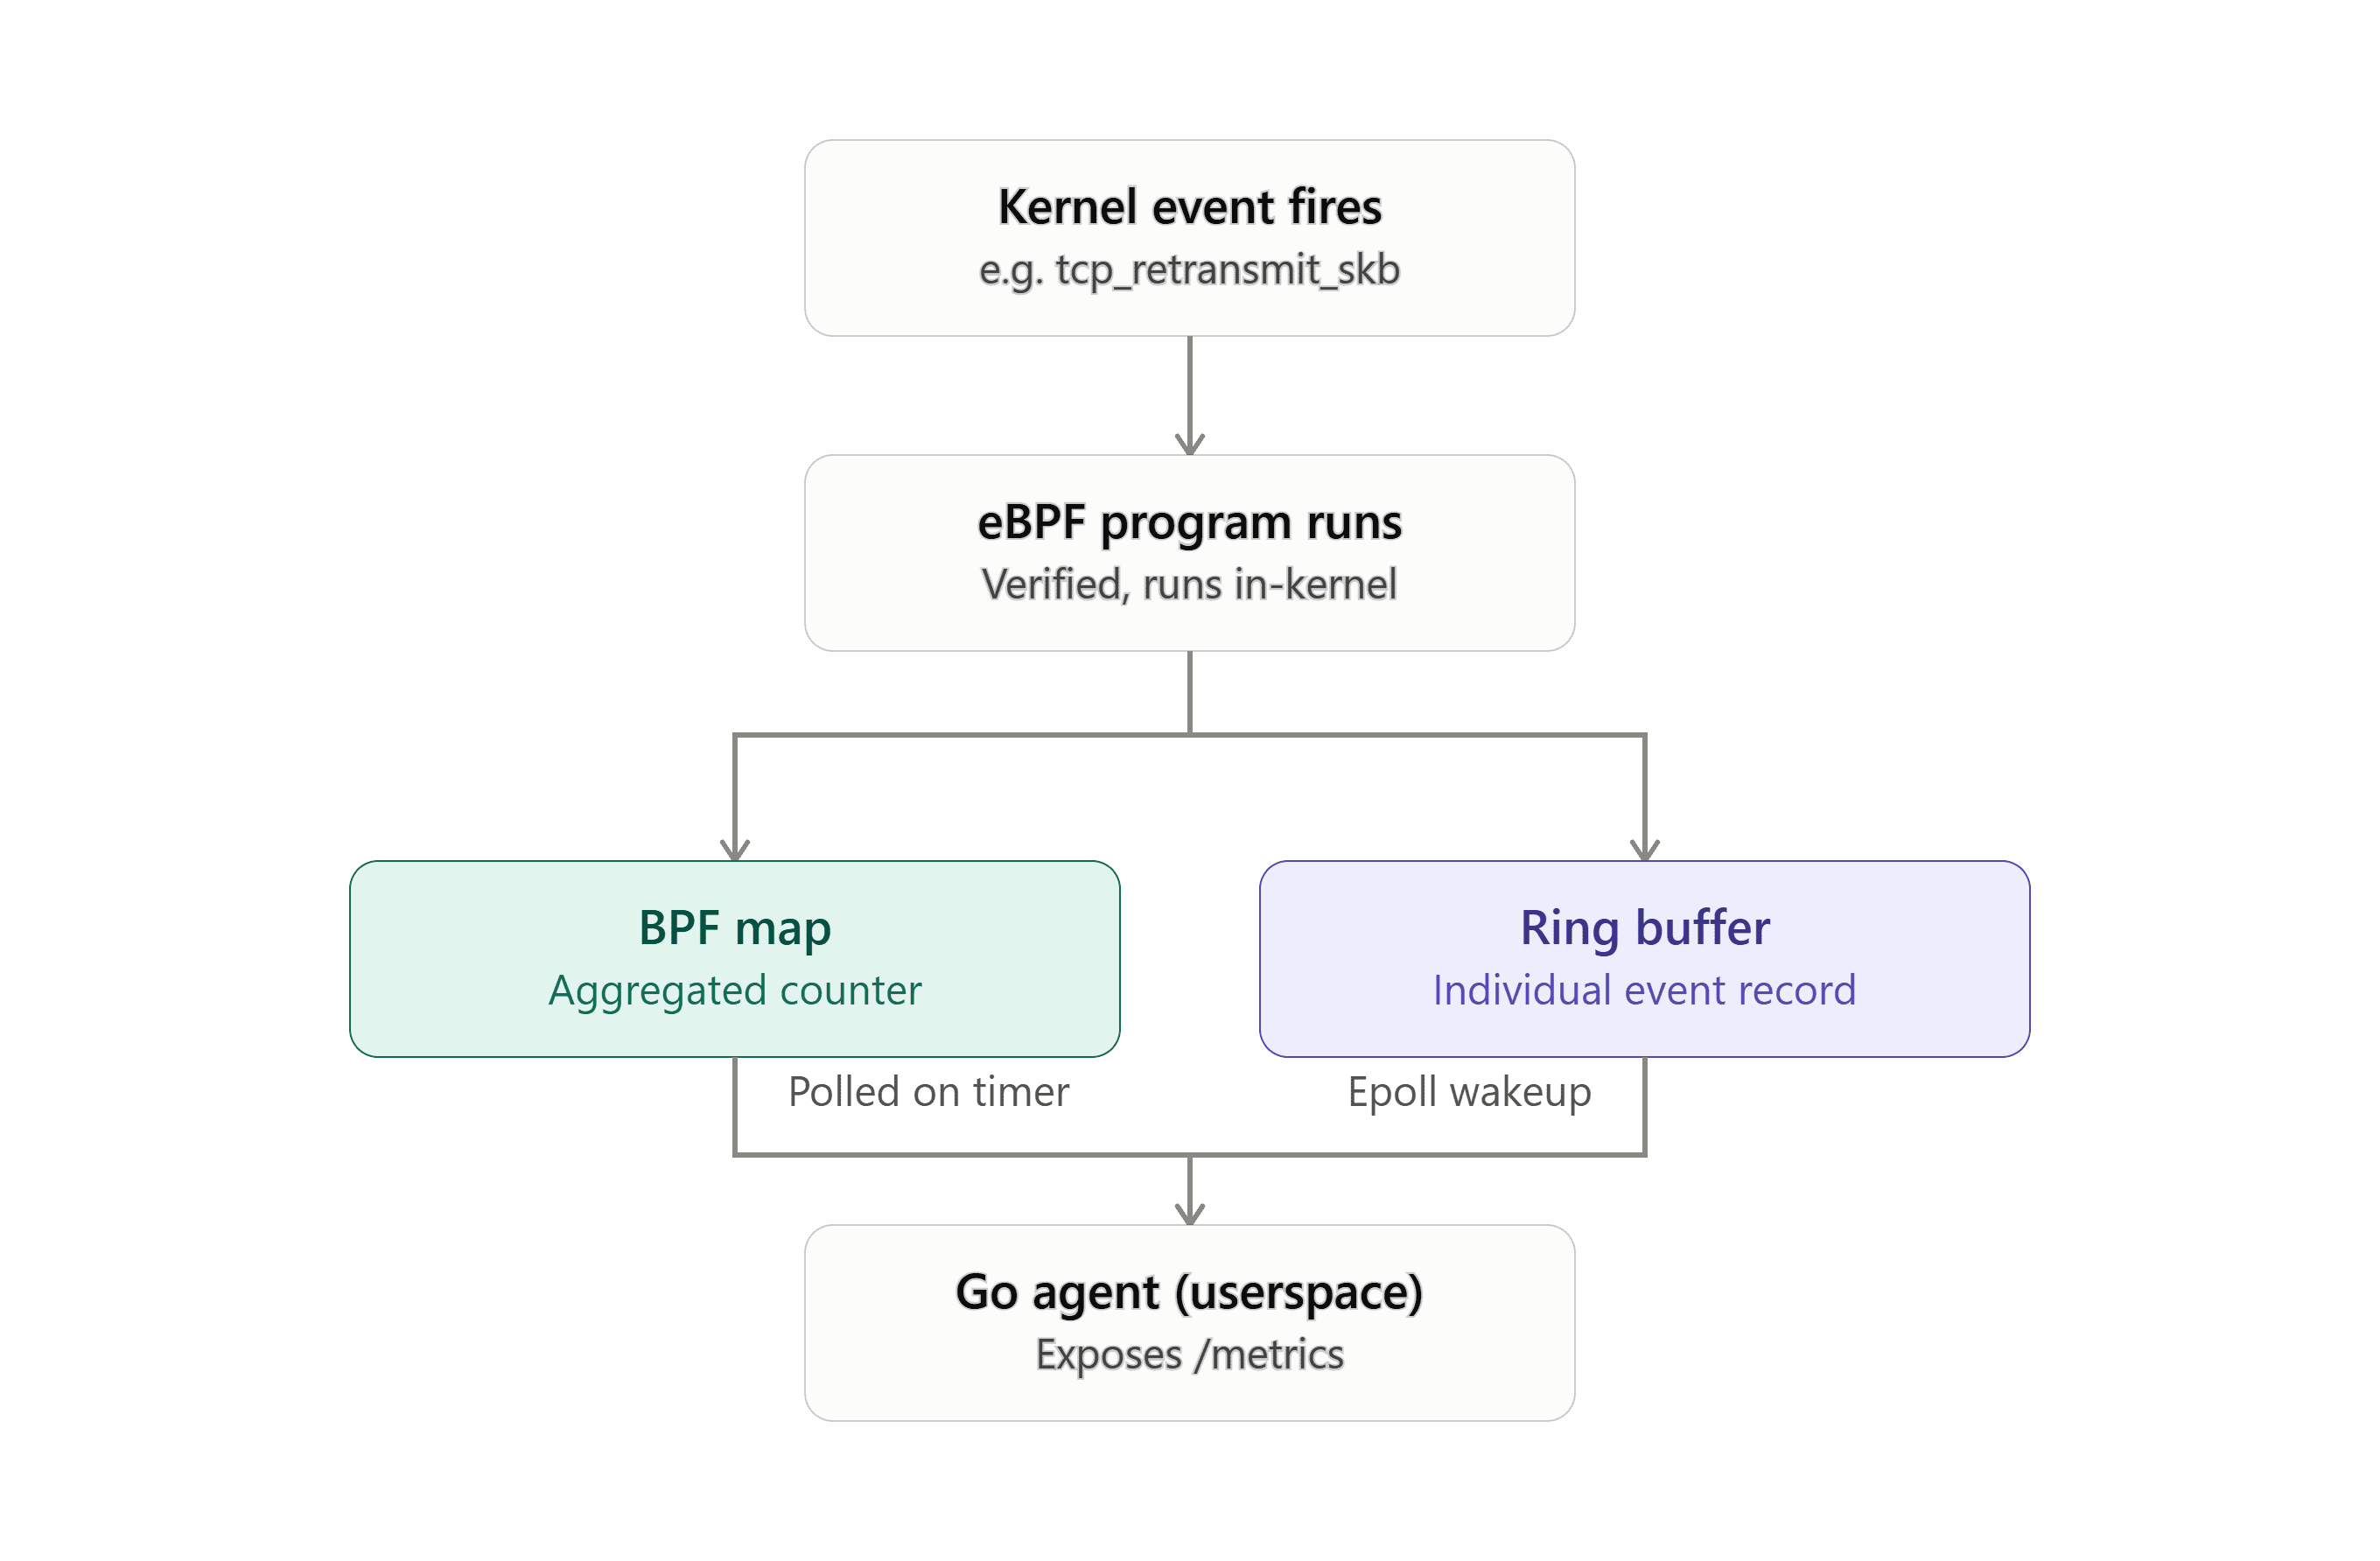
An eBPF program runs inside kernel, so the results have to be passed to the agent in user space. netwatch uses two techniques, based on trigger,
BPF maps - hold counters and state inside the kernel. The Go agent periodically reads those. This is useful when we want aggregated values rather than every individual event like bytes sent or connections opened. Maps are also used inside the kernel to remember a start time until the matching end event arrives, as in the scheduling, DNS and disk latency probes.
BPF ring buffers writes individual event records to user space as they happen. This suits signals where per-event detail matters, such as timestamps and connection endpoints for a retransmit.
Netwatch Introduction
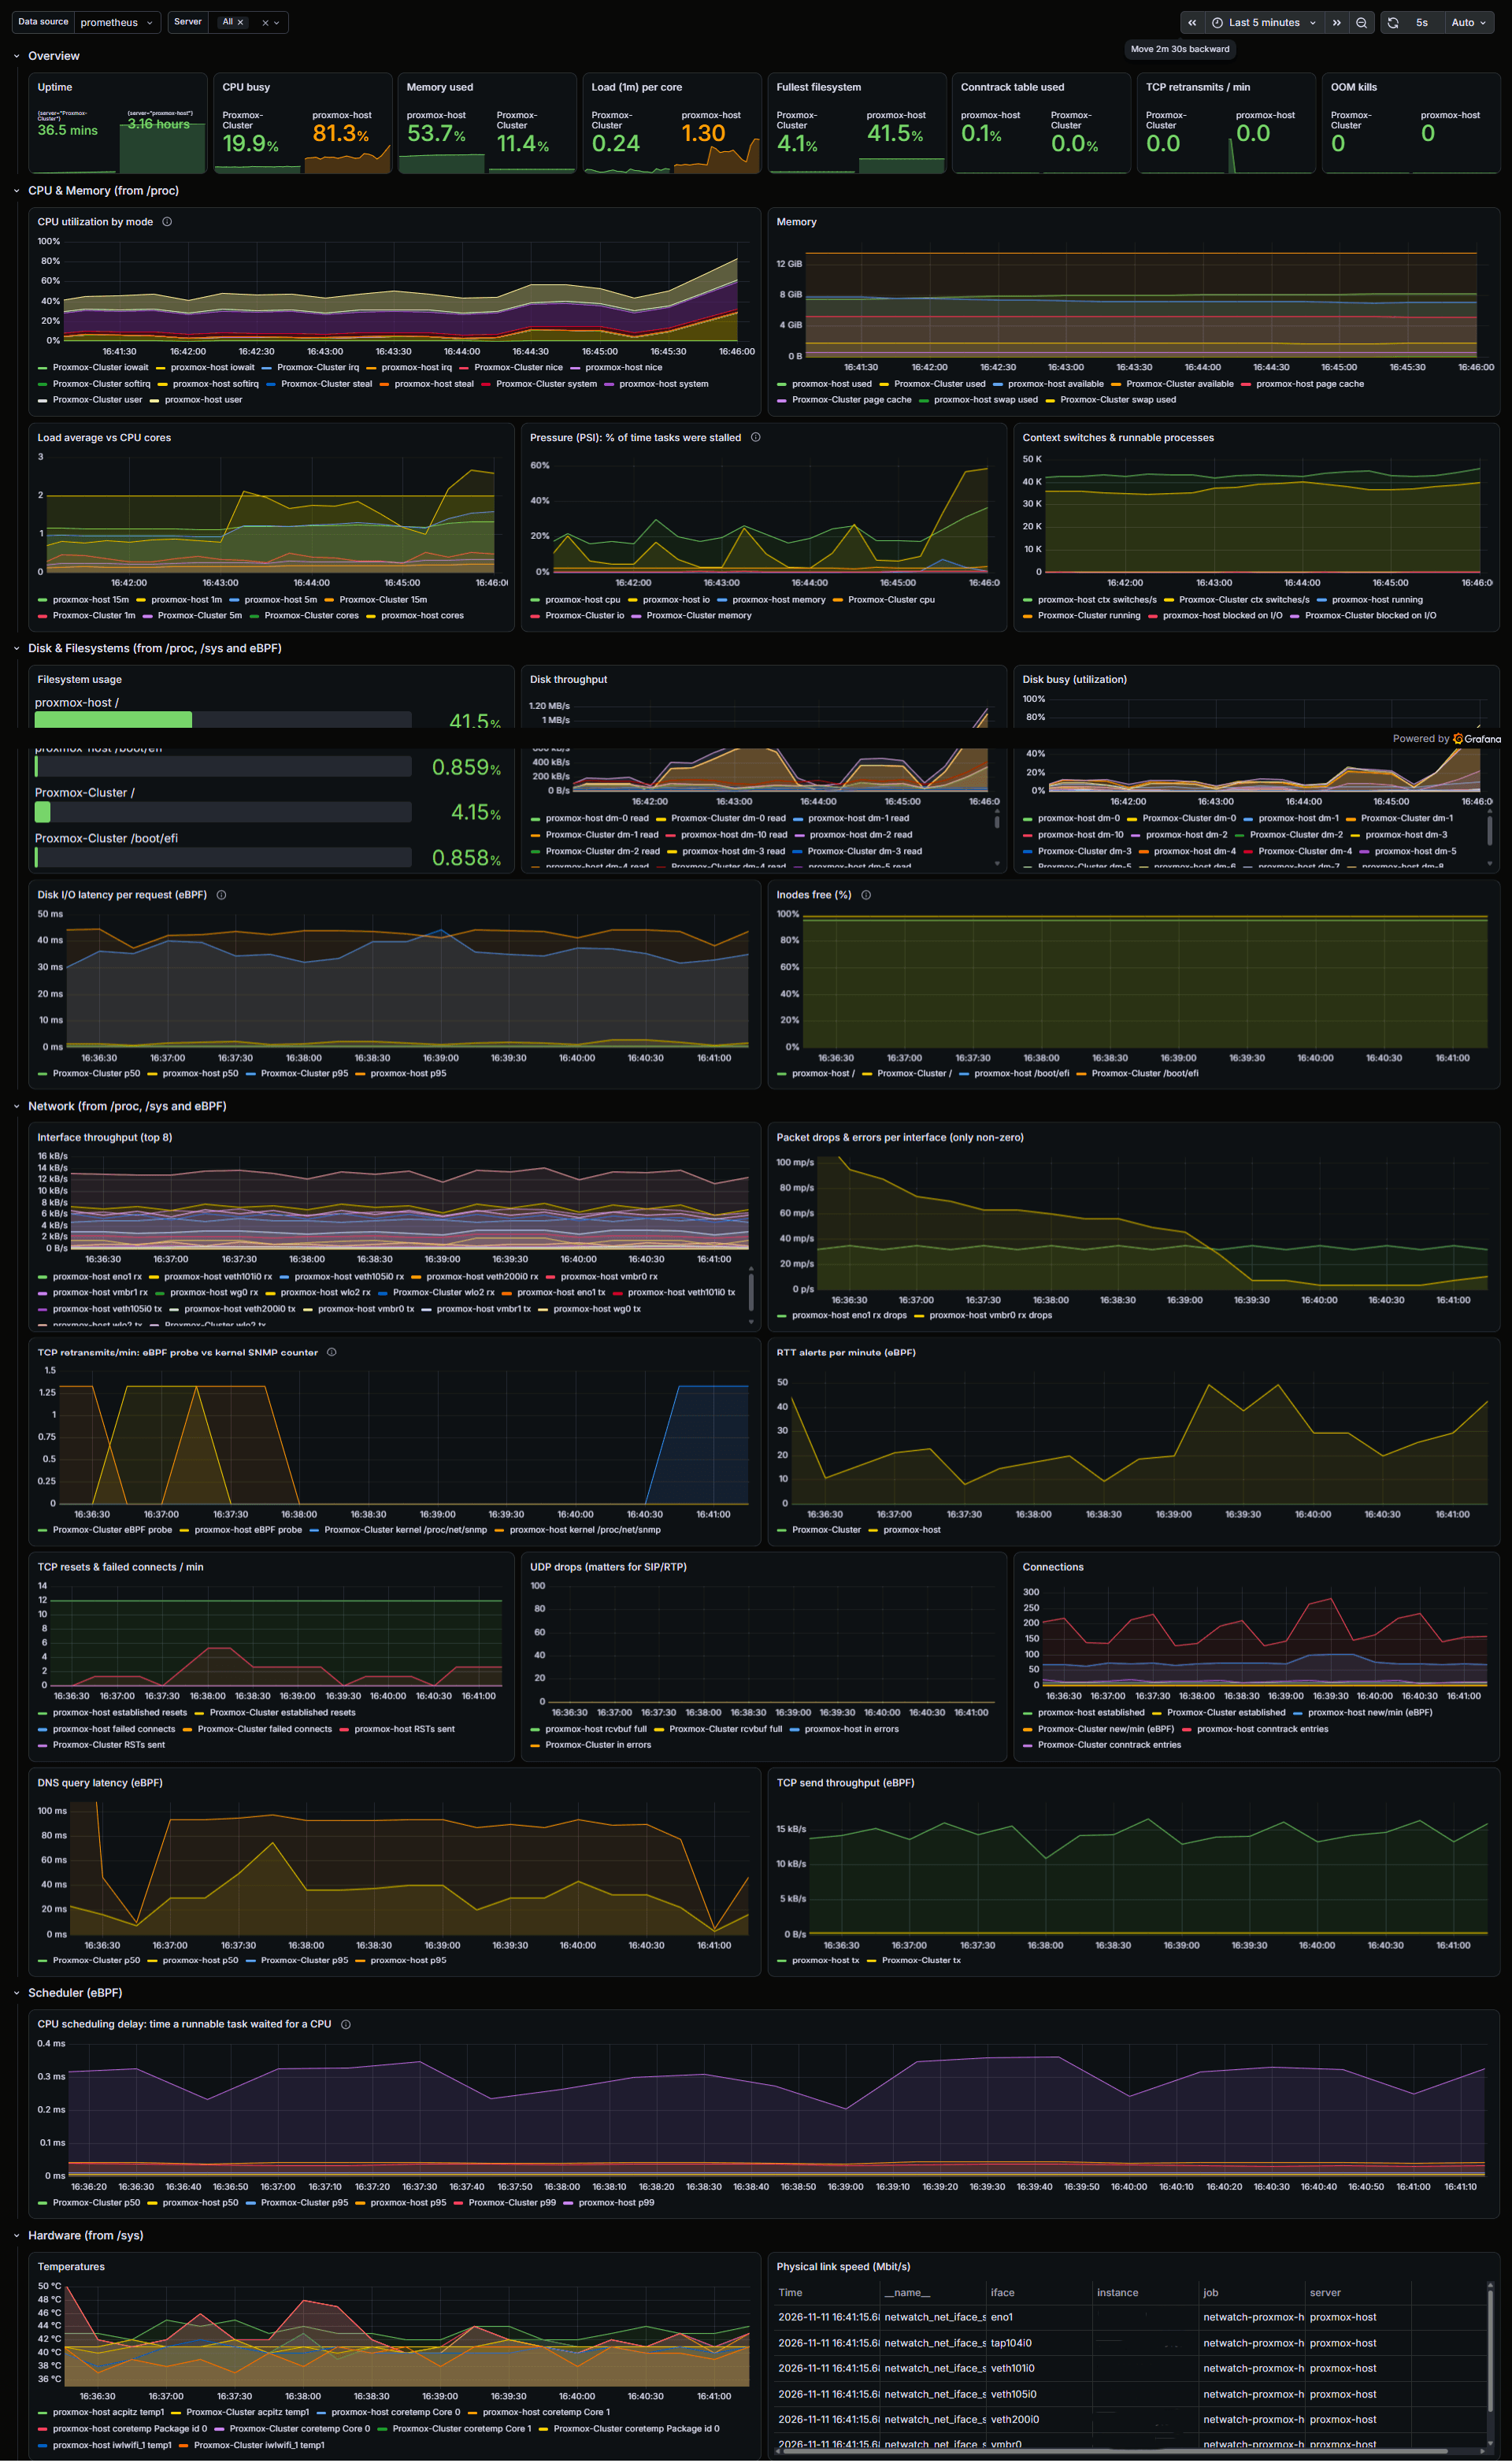
Netwatch is a single Go binary that attaches eBPF probes to kernel events and exposes what they see as Prometheus metrics. Grafana helps expose those metrics as a dashboard.
1
netwatch agent (eBPF probes) <── scrape every 15 s ── Prometheus ──> Grafana
- one binary
- no packet capture: the probes read kernel events and state directly
- events are captured in the kernel as they happen, and Prometheus samples the aggregated counters every 15 s
Collected signals
These come from eBPF probes:
| Signal | Hook | What it tells you |
|---|---|---|
| TCP retransmits | kprobe/tcp_retransmit_skb | a segment had to be sent again (IPv4 only), logged with its source and destination |
| RTT and congestion window | kprobe/tcp_rcv_established | the kernel’s own smoothed RTT and congestion window for a connection |
| DNS latency | kprobe/udp_sendmsg, kprobe/udp_queue_rcv_skb | time from sending a query to port 53 until a UDP packet comes back on the same source port |
| Throughput | kprobe/tcp_sendmsg | bytes the applications asked TCP to send |
| Connection rate | kprobe/tcp_set_state | connections reaching ESTABLISHED, incoming and outgoing |
| CPU scheduling delay | tp_btf/sched_wakeup, tp_btf/sched_switch | how long a task waited between becoming runnable and getting a CPU |
| Disk I/O latency | tp_btf/block_rq_issue, tp_btf/block_rq_complete | time from a block request being issued to it completing |
| OOM kills | kprobe/oom_kill_process | fires when the kernel picks a process to kill (the victim isn’t recorded yet) |
On top of the probes, netwatch reads /proc and /sys for the usual resource numbers: CPU time by mode, memory, load average, filesystem space and inodes, per-interface traffic and drops, disk throughput and utilization, PSI (pressure stall information), connection tracking table usage and temperatures.
Why Go + eBPF CO-RE?
first version I built used Python and BCC, which is a easy way to start with eBPF. BCC compiles the eBPF C code at runtime, every time the program starts, on the machine it runs on. That means every host needs clang, LLVM and matching kernel headers installed, and the compile step adds CPU and memory load at startup.
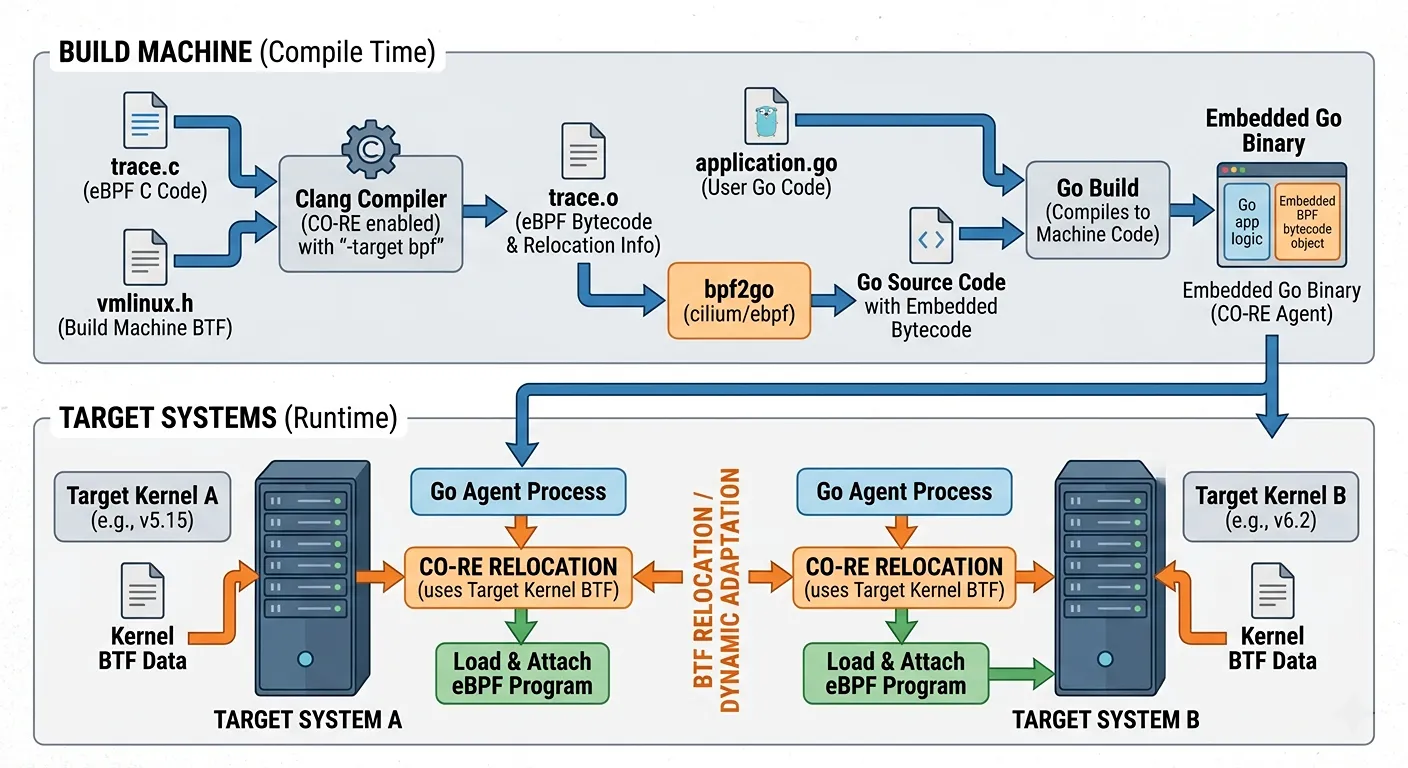
CO-RE (Compile Once, Run Everywhere) solves this. The eBPF C code is compiled once, on the build machine, into a object file. That file contains relocation information, so when the program is loaded, the target kernel’s BTF (BPF Type Format) data is used to adjust struct field offsets for that kernel. bpf2go embeds the object file into the Go binary, so the result is a single file with no clang, no headers and no Python on the target. The one requirement is that the target kernel exposes BTF (see Requirements below).
I wrote the userspace side in Go instead of C with libbpf because most of the work is around the kernel program, not in it. one goroutine per ring buffer reader, the official Prometheus client library, and a standard build and test toolchain. Doing the same in C would have been managing threads and HTTP handling by hand.
Code Walkthrough
Structure
1
2
3
4
5
6
7
8
9
10
netwatch-go/
├── gen.go              # go:generate directive that runs bpf2go
├── bpf/
│   ├── retransmit.c    # all eBPF probes
│   └── vmlinux.h       # kernel type definitions, dumped from the host's BTF
├── main.go             # agent: loads and attaches probes, reads events, serves /metrics
├── sysparse.go         # reads /proc and /sys
├── sysmetrics.go       # turns those readings into Prometheus metrics
├── go.mod
└── go.sum
Build flow
1
2
3
4
5
6
gen.go (go:generate) ──> bpf2go ──> clang compiles bpf/retransmit.c (using vmlinux.h)
                                        │
                                        ├─> netwatch_bpfel.o   (eBPF bytecode)
                                        └─> netwatch_bpfel.go  (Go glue, with the .o embedded)

main.go, sysparse.go, sysmetrics.go, netwatch_bpfel.go ──> go build ──> netwatch-go (single binary)
Compilation
1
//go:generate go run github.com/cilium/ebpf/cmd/bpf2go -no-strip -cc clang -cflags "-O2 -g -Wall -D__TARGET_ARCH_x86" netwatch bpf/retransmit.c -- -I./bpf
bpf2gois the tool fromcilium/ebpfthat runs clang on the eBPF C code and generates Go bindings for the compiled object.-cc clangpicks the compiler.-no-stripkeeps debug info in the object file.-cflags "..."are the flags passed to clang:-O2is required because clang only produces valid eBPF with optimization on.-gadds debug info.-Wallenables warnings.-D__TARGET_ARCH_x86tells the libbpf headers which CPU architecture’s register layout to use for kprobes.
netwatchis the name prefix for the generated Go identifiers (netwatchObjects,loadNetwatchObjects) and files.bpf/retransmit.cis the source file.-- -I./bpfadds thebpf/folder to clang’s include path so it findsvmlinux.h.
Compilation happens once, on the build machine, and the target host only needs the resulting binary.
Kernel level: bpf/retransmit.c
Three kinds of BPF data structures:
| Map | Used for | Like |
|---|---|---|
| ring buffer | one record per event | syslog |
| array | a running counter | SNMP counter |
| hash | remember a start time, look it up later | a lease table |
Kernel-side implementation
Probe 1: TCP retransmits
1
2
3
4
5
6
7
8
9
10
11
12
13
14
15
16
17
18
19
20
SEC("kprobe/tcp_retransmit_skb") // runs every time TCP resends a segment
int BPF_KPROBE(trace_tcp_retransmit_skb, struct sock *sk) {
    __u16 family = BPF_CORE_READ(sk, __sk_common.skc_family);
    if (family != AF_INET) { //skip non ipv4
        return 0;
    }

    struct retransmit_event *event;
    event = bpf_ringbuf_reserve(&events, sizeof(*event), 0); //claim space
    if (!event) { //reserve fail if buffer is full
        return 0;
    }

    //copy
    event->saddr = BPF_CORE_READ(sk, __sk_common.skc_rcv_saddr); //source ip
    event->daddr = BPF_CORE_READ(sk, __sk_common.skc_daddr); //dest ip
    event->sport = BPF_CORE_READ(sk, __sk_common.skc_num); //source port
    event->dport = BPF_CORE_READ(sk, __sk_common.skc_dport); //dest port

        ...
BPF_CORE_READ reads struct fields by name, and the field offsets are resolved when the program is loaded. That is what keeps it portable across kernel versions. Writing straight into reserved ring buffer memory also avoids an extra copy. The if (!event) check is not optional: the verifier refuses to load the program without it (see the Verifier section).
Probe 2: RTT and congestion window
1
2
3
4
5
6
SEC("kprobe/tcp_rcv_established")                // runs for nearly every received segment
    ...
    event->srtt_us  = BPF_CORE_READ(ts, srtt_us) >> 3;   // kernel's own RTT estimate (stored x8)
    event->snd_cwnd = BPF_CORE_READ(ts, snd_cwnd);       // packets allowed in flight
    bpf_ringbuf_submit(event, 0);
This reads the kernel’s own estimates instead of measuring RTT separately. A high RTT together with a congestion window that has collapsed to 1 or 2 segments means the TCP stack itself has decided the path is in trouble. Because this hook fires so often, it is also the most expensive probe .
Probe 3: CPU scheduling delay
1
2
3
4
5
6
7
8
9
10
11
12
13
14
15
16
SEC("tp_btf/sched_wakeup")        // a task became runnable
int BPF_PROG(trace_sched_wakeup, struct task_struct *p) {
    __u32 pid = BPF_CORE_READ(p, pid);
    __u64 ts = bpf_ktime_get_ns();
    bpf_map_update_elem(&wakeup_ts, &pid, &ts, BPF_ANY);   // remember: "pid X woke at time T"
    return 0;
}

SEC("tp_btf/sched_switch")        // the CPU is switching to run a task
int BPF_PROG(trace_sched_switch, bool preempt, struct task_struct *prev, struct task_struct *next) {
    __u32 next_pid = BPF_CORE_READ(next, pid);
    __u64 *wakeup = bpf_map_lookup_elem(&wakeup_ts, &next_pid);
    if (!wakeup) { return 0; }                              // never saw it wake: ignore
    __u64 delay_ns = bpf_ktime_get_ns() - *wakeup;          // now minus wakeup time
    bpf_map_delete_elem(&wakeup_ts, &next_pid);
    ...
This measures run-queue latency: the time between a task becoming runnable and getting a CPU. CPU utilization graphs don’t usually show it, but applications feel it as stalls when the CPU is contended. In the kernel, pid is really the thread ID, so here is tracking per thread.
Probe 4: DNS latency
1
2
3
4
5
6
7
8
9
SEC("kprobe/udp_sendmsg")                       // sending a UDP
    ...
    if (dport != DNS_PORT_BE) return 0;         // only if the dst.port = 53
    bpf_map_update_elem(&dns_start, &sport, &ts, BPF_ANY);

SEC("kprobe/udp_queue_rcv_skb")                 // arriving a UDP
    ...
    start_ts = bpf_map_lookup_elem(&dns_start, &sport);      // check dns query
    latency = now - *start_ts;
A query is timestamped when it is sent, keyed by source port, and matched when a packet arrives on the same port. The same pattern (save a time, look it up later, subtract) is used for scheduling and disk latency.
Probe 5: throughput and connection rate
1
2
3
4
5
6
7
8
9
10
SEC("kprobe/tcp_sendmsg")
int BPF_KPROBE(trace_tcp_sendmsg, struct sock *sk, struct msghdr *msg, size_t size) {
    ...
    __sync_fetch_and_add(tx, size);        // add byte count
}

SEC("kprobe/tcp_set_state")
int BPF_KPROBE(trace_tcp_set_state, struct sock *sk, int state) {
    if (state == TCP_ESTABLISHED_STATE) {  // handshake completed
        ... __sync_fetch_and_add(count, 1);
Both update atomic counters in array maps. No ring buffer is involved, so the cost per event is a single atomic add, and the agent reads the totals every 2 seconds. Note that size is the number of bytes the application asked TCP to send, not bytes on the wire.
Probe 6: disk I/O latency
1
2
3
4
5
6
7
SEC("tp_btf/block_rq_issue")           // request handing disk
    __u64 key = (__u64)rq;             // using request address as ID
    bpf_map_update_elem(&disk_start, &key, &ts, BPF_ANY);

SEC("tp_btf/block_rq_complete")        // disk finished it
int BPF_PROG(trace_block_rq_complete, struct request *rq, int error, unsigned int nr_bytes) {
    ... latency = now - start ...
Answer for “is the storage itself slow?” can be here. A slow disk can make every service on the machine look sluggish, even when CPU and network are fine. The time measured is from issue to completion, so it is the time the device took. It does not include time a request waited in the block layer queue, which is why iostat’s w_await can be higher. disk_start is an LRU map, so if requests never complete, old entries are evicted instead of blocking new ones.
Probe 7: OOM kill
1
2
3
4
5
SEC("kprobe/oom_kill_process")
int BPF_KPROBE(trace_oom_kill, void *oc, const char *message) {
    ...
    event->victim_pid = 0;    // placeholder: check dmesg for who was killed
    bpf_ringbuf_submit(event, 0);
The probe fires when the kernel picks a process to kill. It doesn’t record which one yet (see Limitations), so dmesg is still needed for the victim.
Userspace level: main.go
- load the embedded eBPF objects - the kernel verifier runs here
- attach 11 hooks (
link.Kprobefor kprobes,link.AttachTracingfor tp_btf) - open 6 ring buffers, one goroutine per buffer
- every 2 seconds, read the 2 array counters (tx bytes, connections) and add the difference
- serve /metrics for Prometheus
1
2
3
4
5
6
7
8
9
func readRetransmitEvents(rd *ringbuf.Reader) {
    for {
        record, err := rd.Read()                                    // sleeps until the kernel submits an event
        if err != nil { return }
        saddr := binary.LittleEndian.Uint32(record.RawSample[0:4])  // raw bytes -> numbers
        ...
        retransmitCounter.Inc()                                     // feeds Prometheus
    }
}
The Go struct must match the C struct byte for byte, or the numbers are silently wrong.
| Signal | Transport out of kernel | Exported as |
|---|---|---|
| retransmits, OOM | ring buffer | counter |
| RTT | ring buffer | counter |
| CPU delay, DNS, disk latency | ring buffer | histogram |
| tx bytes, connections | array map, polled every 2 s | counter |
What each metric actually measures
| Metric | What exactly is measured | Reference | Expected difference |
|---|---|---|---|
| TCP retransmits | calls to tcp_retransmit_skb (IPv4 only) | TcpRetransSegs from nstat | close, not identical: the reference counts all address families |
| RTT | the kernel’s smoothed RTT (srtt_us >> 3) sampled at tcp_rcv_established, not the round trip of one packet | rtt: in ss -ti | should match closely, it’s the same kernel value |
| Congestion window | snd_cwnd, in segments | cwnd: in ss -ti | should match |
| DNS latency | udp_sendmsg to port 53 until a UDP packet arrives on the same source port | Query time from dig | slightly higher than dig, and with systemd-resolved it measures the local stub, not the upstream server |
| Throughput | bytes the application asked tcp_sendmsg to send | bytes reported by iperf3 | close: it is the requested size, not bytes on the wire (no headers, no retransmissions) |
| Connection rate | transitions to ESTABLISHED, both outgoing and incoming | TcpActiveOpens + TcpPassiveOpens from nstat | close |
| CPU scheduling delay | time from sched_wakeup to sched_switch for the same thread | run queue in vmstat, /proc/pressure/cpu | trend should agree, there is no per-event reference |
| Disk latency | time from block_rq_issue to block_rq_complete | w_await in iostat -x | netwatch should be lower or equal: iostat also counts time in the block layer queue |
| OOM kills | calls to oom_kill_process | dmesg | one OOM event can kill more than one process |
/proc & /sys
| File | Metrics |
|---|---|
/proc/stat | CPU time per mode, context switches |
/proc/meminfo | RAM, cache, swap |
/proc/loadavg | load average |
/proc/mounts + statfs | filesystem size, free, inodes |
/proc/net/dev, /sys/class/net | bytes, errors, drops, link state per interface |
/proc/diskstats | disk throughput, busy time |
/proc/pressure/* | PSI: time tasks spent stalled |
/proc/net/snmp | kernel’s own TCP/UDP counters (cross-check for the eBPF retransmit count) |
/sys/class/hwmon | temperatures |
Prometheus and Grafana
1
2
3
4
server: netwatch-go ──> :9107/metrics
                                  │  Prometheus scrapes every 15 s
                                  ▼
                             Prometheus ──> Grafana (dashboard)

Grafana turns a counter into a rate:
1
rate(netwatch_tcp_retransmits_total[1m]) * 60        # retransmits per minute
One event, end to end: tcp_retransmit_skb runs -> probe writes 12 bytes -> ring buffer -> Go goroutine wakes -> counter +1 -> Prometheus scrape -> Grafana panel.
Use Cases
| Symptom | Look at | What it suggests |
|---|---|---|
| App is slow but CPU % is low | CPU scheduling delay p95, /proc/pressure/cpu | tasks are waiting for a CPU even though average utilization looks fine |
| Transfers are slow or stall | TCP retransmits, RTT, cwnd | loss or a congested path. RTT up with cwnd collapsing means the kernel itself is backing off |
| Name resolution is slow | DNS latency | a slow resolver. With systemd-resolved, check whether the delay is local or upstream |
| Disk operations are slow | disk latency, /proc/pressure/io | the device is slow or saturated |
| A service vanished | OOM kill counter, then dmesg | if the counter moved, the kernel killed something. dmesg shows which process, since netwatch doesn’t record the victim yet |
| Sudden spike in connections | connection rate, connection tracking usage, TCP retransmits | a traffic surge, a port scan, or clients retrying in a loop |
p95 is the 95th percentile: 95% of the measurements are at or below that value, so it shows the slow tail that averages hide.
For the connection spike, the rate counts incoming and outgoing handshakes together, so check ss -tn for the direction and the remote addresses. A rising rate together with retransmits suggests clients are reconnecting because their connections are failing. High connection tracking usage matters because a full table starts dropping new connections.
Deployment
Requirements
Tested on: Proxmox VE 9.0.3 Debian 13 “trixie”, kernel 6.14.8-2-pve, Go 1.24.4, clang 19.1.7.
- ring buffers need kernel 5.8 or newer
tp_btfneeds kernel 5.5 or newer- CO-RE needs the kernel built with
CONFIG_DEBUG_INFO_BTF=y(check that/sys/kernel/btf/vmlinuxexists) - the target host needs no clang, LLVM or kernel headers, only the binary
Build & Run
1
2
3
4
bpftool btf dump file /sys/kernel/btf/vmlinux format c > bpf/vmlinux.h #Dumps the kernel's type information into `vmlinux.h`
go generate ./...
go build -o netwatch-go .
sudo ./netwatch-go -prometheus-port 9107
On the machine that builds it: Go, clang, bpftool and the libbpf headers. On Debian that is roughly apt install clang libbpf-dev bpftool, plus Go.
Run as a service
Running it in the foreground stops when the terminal session closes, so run it as a systemd service to keep it running permanently.
1
2
3
4
5
6
7
8
9
10
11
12
[Unit]
Description=netwatch eBPF monitoring agent
After=network-online.target
Wants=network-online.target

[Service]
ExecStart=/usr/local/bin/netwatch-go -listen 0.0.0.0:9107
Restart=on-failure
User=root

[Install]
WantedBy=multi-user.target
On the build machine, make install will do the all
1
2
make install
sudo systemctl status netwatch

To run it on another server, no Go, clang or kernel headers are needed there. Just Copy the binary and the unit file, then install them:
1
scp netwatch-go deploy/netwatch.service root@<server>:/root/
1
2
3
4
install -m 0755 netwatch-go /usr/local/bin/netwatch-go
install -m 0644 netwatch.service /etc/systemd/system/netwatch.service
systemctl daemon-reload
systemctl enable --now netwatch
Restrict metrics port
/metrics exposes internal IPs, ports and connection patterns, and the agent currently listens on all interfaces. Only the Prometheus server should be able to reach it. Restrict Everyone else:
1
2
sudo ufw allow from <prometheus-ip> to any port 9107 proto tcp
sudo ufw deny 9107/tcp
Prometheus and an alert
prometheus.yml
1
2
3
4
5
scrape_configs:
  - job_name: netwatch
    scrape_interval: 15s
    static_configs:
      - targets: ['server1:9107', 'server2:9107']
Sample Alert Rule : netwatch-rules.yml
1
2
3
4
5
6
7
8
groups:
  - name: netwatch
    rules:
      - alert: HighTcpRetransmits
        expr: rate(netwatch_tcp_retransmits_total[5m]) * 60 > 100
        for: 10m
        annotations:
          summary: "High TCP retransmit rate on {{ $labels.instance }}"
The threshold of 100 per minute is only an example. Look at your own normal retransmit rate in Grafana first, then set the threshold above it.
Verifier
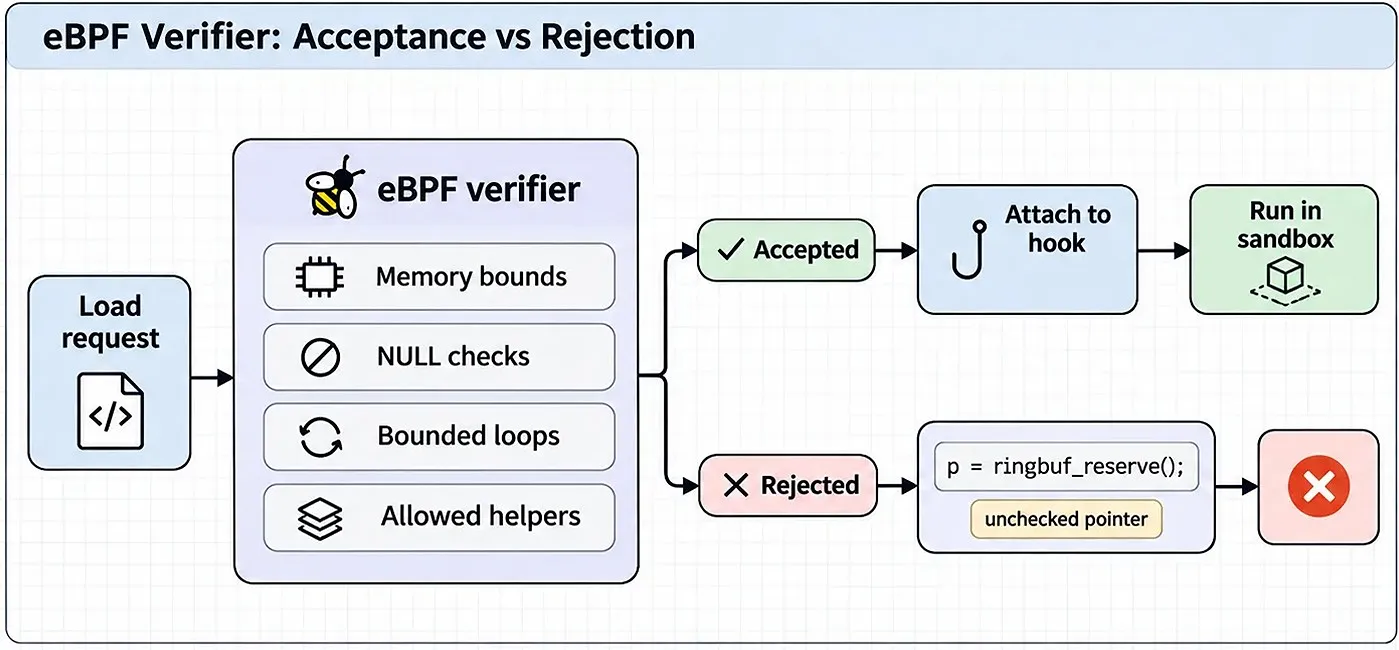
The verifier is what makes this safe, so I wanted to see it reject something. I took Probe 1 and removed the NULL check after bpf_ringbuf_reserve:
1
2
3
4
5
event = bpf_ringbuf_reserve(&events, sizeof(*event), 0);
// if (!event) {
//     return 0;
// }                              <-- removed
event->saddr = BPF_CORE_READ(sk, __sk_common.skc_rcv_saddr);
bpf_ringbuf_reserve can fail and return NULL, so writing to the result without checking is a possible NULL dereference. clang compiles this without complaint, but the kernel verifier rejects the program when it is loaded:
1
2
3
4
5
6
7
8
; event = bpf_ringbuf_reserve(&events, sizeof(*event), 0); @ retransmit.c:59
15: (85) call bpf_ringbuf_reserve#131   ; R0=ringbuf_mem_or_null(id=3,ref_obj_id=3,sz=12)
16: (bf) r7 = r0                        ; R7_w=ringbuf_mem_or_null(id=3,ref_obj_id=3,sz=12)
...
; event->saddr = BPF_CORE_READ(sk, __sk_common.skc_rcv_saddr); @ retransmit.c:64
24: (61) r1 = *(u32 *)(r10 -4)
25: (63) *(u32 *)(r7 +0) = r1
R7 invalid mem access 'ringbuf_mem_or_null'
bpf_ringbuf_reservereturnsringbuf_mem_or_null, which means “valid memory or NULL”. The verifier tracks that state through every register the pointer is copied into.- At instruction 25 the program writes through
R7without having checked for NULL, so the verifier refuses to load it. - The error says
permission deniedeven though I ran it as root. That is only the error code the kernel uses for any verifier rejection, not a privilege problem.
Putting the check back makes the program load.